
9 Best Dev Team Analytics Software Tools in 2026
This guide reviews the 9 best dev team analytics software tools in 2026, helping engineering leaders transform scattered GitHub activity, sprint data, and deployment logs into clear, actionable insights. Evaluated on integration depth, AI capabilities, and insight quality, these platforms help CTOs and engineering managers identify bottlenecks, reduce deployment risk, and monitor team health across startups and scaling SaaS organizations.
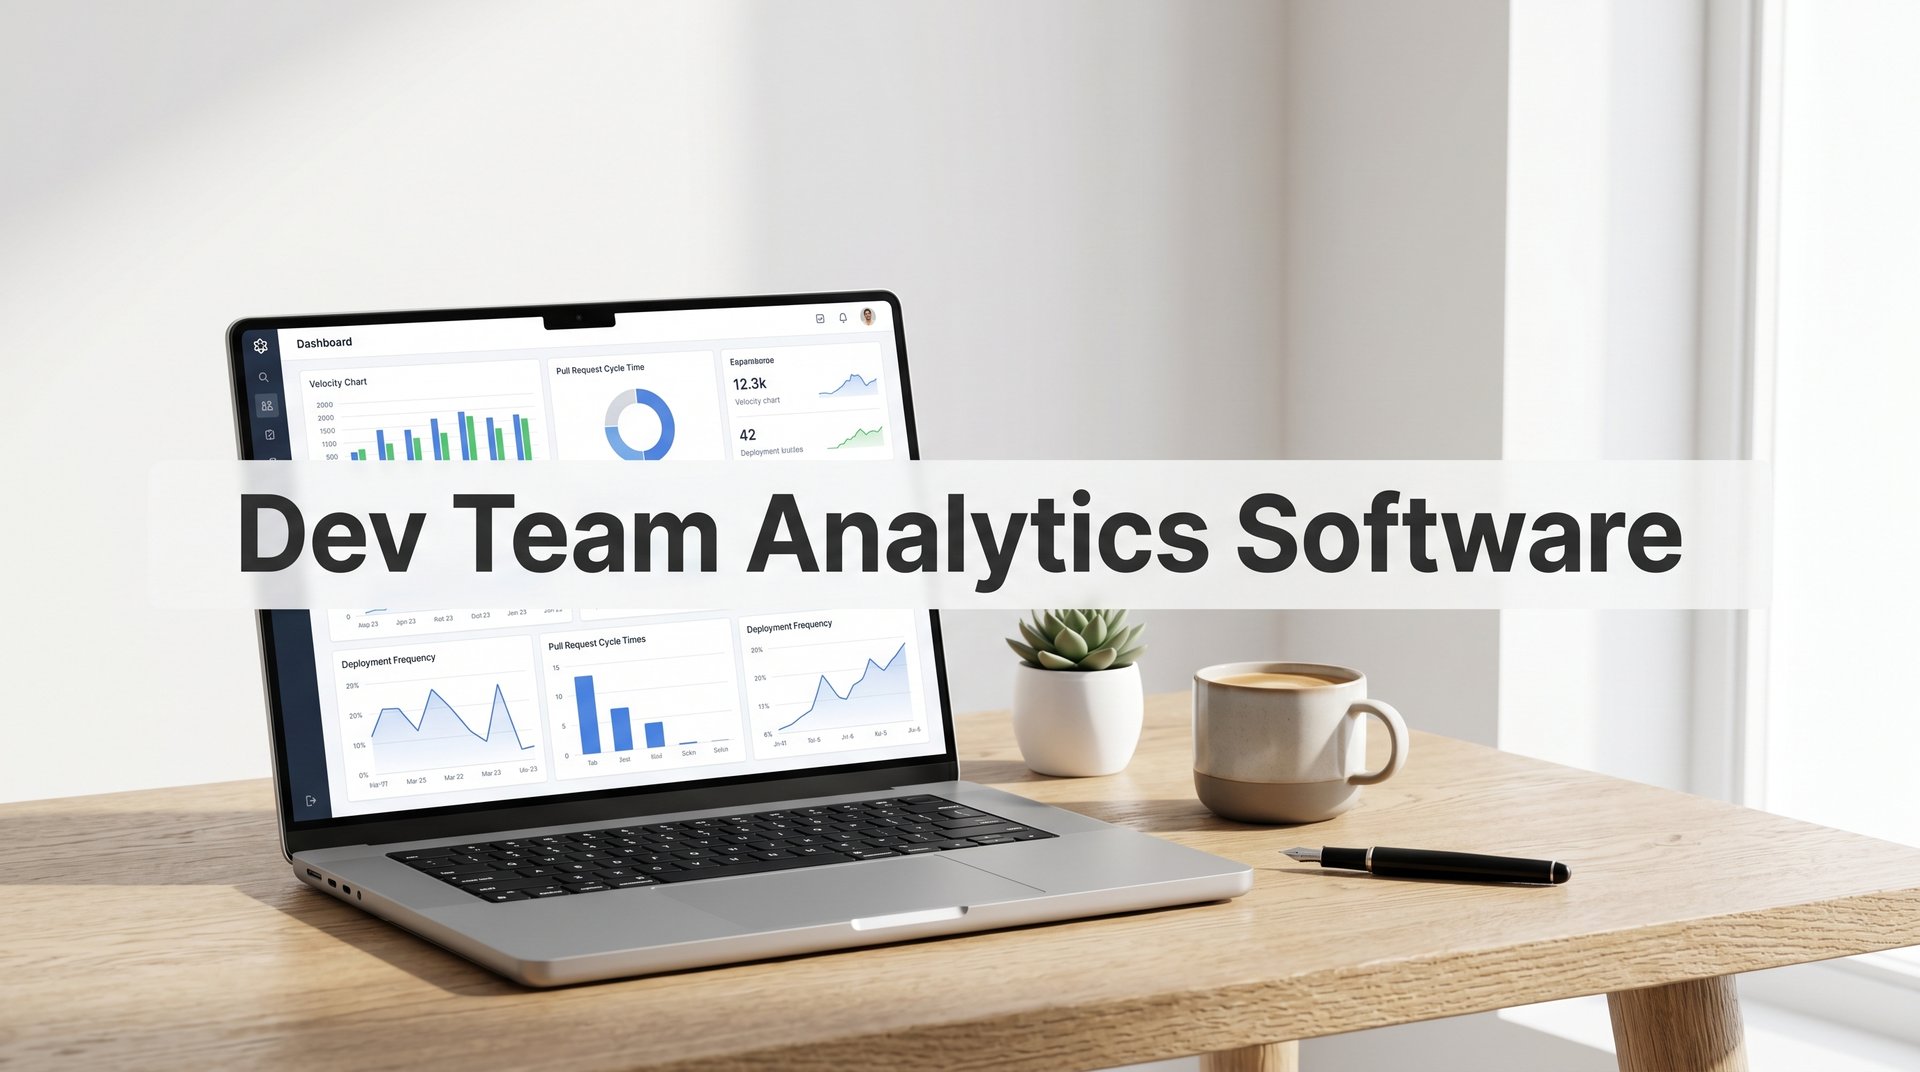
Most engineering leaders are drowning in data but starving for insight. You've got GitHub activity, Linear tickets, deployment logs, and sprint reports — but stitching them into a clear picture of what's actually happening takes hours you don't have.
Dev team analytics software solves this by turning raw development activity into actionable signals: where work is stalling, which deployments carry risk, and whether your team is building momentum or quietly burning out. The category has matured significantly, splitting into metrics dashboards, engineering intelligence platforms, and business alignment tools — each serving different needs at different stages of growth.
This list covers the top tools available in 2026, evaluated on depth of insight, ease of integration, AI capabilities, and how well they serve technical leaders at startups and scaling SaaS teams. Whether you're a CTO trying to spot risks before they hit production, an engineering manager tracking team health, or a founder who needs a clear read on delivery pace, there's a tool here for you. We've included Progress as our top pick because it's what we build, and we think it genuinely earns that spot.
1. Progress
Best for: Technical leaders who need interpreted risk signals, not just raw dashboards
Progress is an AI-native engineering intelligence platform that ingests data from GitHub, Linear, and similar tools to deliver pre-computed risk signals, team health reads, and decision-ready assessments.
Where This Tool Shines
Most analytics tools hand you a dashboard and leave the interpretation to you. Progress takes a different approach: it does the analysis for you. Instead of staring at charts and wondering what the spike in code churn means, you get a pre-computed assessment telling you where the risk is, what's stalling, and how your team is actually doing.
The human layer is where Progress stands apart from most competitors. It tracks team momentum and morale signals alongside delivery metrics, giving technical leaders a read on team health before problems show up in sprint velocity or missed deadlines. For startup CTOs and engineering managers who wear many hats, this kind of proactive signal is genuinely useful.
Key Features
Pre-Computed Operational Signals: Automatically flags stalled work and emerging risks across your codebase and team, so you're not manually hunting for problems.
Deployment Risk Assessment: Evaluates deployment risk and change pressure based on merge volume and code churn, giving you a concrete read before you ship.
Team Momentum and Morale Reads: Tracks whether work is accelerating or slowing and surfaces wellness signals that most engineering tools ignore entirely.
Natural-Language Q&A: An MCP server and Claude API integration let you ask plain-language questions about engineering activity and get answers grounded in real data, not vanity metrics.
On-Demand Executive Summaries: Generates clear, decision-ready summaries for leadership conversations without requiring manual report assembly.
Best For
Progress is a strong fit for startup CTOs, engineering VPs, and dev managers at scaling SaaS teams who need to act on engineering data quickly. If your current process involves manually stitching together GitHub exports and Linear reports before every leadership meeting, this tool was built for you.
Pricing
Contact for pricing. Visit seeprogress.ai for details and to request a demo.
2. LinearB
Best for: Engineering teams that want DORA metrics with AI-assisted sprint planning
LinearB is an engineering metrics platform offering DORA and SPACE framework tracking, sprint intelligence, and AI-assisted workflow automation.
Where This Tool Shines
LinearB has built strong credibility in the DORA metrics space, and its benchmarking capabilities are genuinely useful for teams that want to compare their delivery performance against industry baselines. Knowing your cycle time is one thing; knowing whether it's fast or slow relative to similar teams adds real context.
The WorkerB AI feature extends beyond reporting into sprint workflows, helping teams with planning-related tasks. This makes LinearB feel more like an active participant in the engineering process rather than a passive observer — a meaningful distinction for teams that want tooling to reduce friction, not just measure it.
Key Features
DORA Metrics with Benchmarking: Tracks deployment frequency, lead time, change failure rate, and MTTR, with industry benchmark comparisons built in.
WorkerB AI: Provides sprint planning assistance and workflow automation to reduce manual overhead in team ceremonies.
Git and Project Management Integrations: Connects to GitHub, GitLab, Jira, and other common tools teams already use.
Team and Org-Level Reporting: Surfaces metrics at both the individual team level and across the broader engineering organization.
Best For
Engineering managers and directors at growth-stage companies who want structured DORA tracking with benchmarking context. Particularly useful for teams that have already bought into the DORA framework and want a polished implementation rather than building their own.
Pricing
Free tier available for smaller teams. Paid plans scale with team size. Visit linearb.io for current pricing.
3. Jellyfish
Best for: Engineering leaders who need to connect technical investment to business outcomes
Jellyfish is an engineering management platform focused on mapping engineering activity to business priorities, with strong executive and board-level reporting capabilities.
Where This Tool Shines
Jellyfish's core differentiator is its Engineering Investment view, which shows how engineering time and capacity maps to product areas, strategic initiatives, and business goals. This is the kind of data that matters when you're sitting in a board meeting or justifying headcount decisions to a CFO.
For VP and CTO-level leaders at larger organizations, Jellyfish provides a layer of business context that purely technical dashboards miss. The tradeoff is that this executive focus can make it feel heavy for early-stage startups that don't yet need that level of organizational reporting.
Key Features
Engineering Investment Allocation: Shows how engineering capacity maps to product areas and strategic initiatives in business terms.
Executive and Board Reporting: Pre-built reporting formats designed for non-technical leadership audiences.
Broad Integrations: Connects with GitHub, Jira, and financial planning tools for a complete operational picture.
Capacity Planning and Headcount Analytics: Helps leaders model team capacity against roadmap commitments.
Best For
Engineering VPs and CTOs at mid-to-large SaaS companies who need to communicate engineering value to executive and board audiences. Less suited to early-stage startups where that reporting layer isn't yet a priority.
Pricing
Enterprise pricing model. Contact Jellyfish directly at jellyfish.co for a quote.
4. Swarmia
Best for: Engineering teams with a strong culture of transparency who want metrics everyone can see
Swarmia is a developer-friendly engineering analytics tool that surfaces metrics to engineers themselves, not just managers, reducing the friction and surveillance perception that kills most metrics programs.
Where This Tool Shines
The biggest challenge with engineering analytics isn't collecting data — it's getting engineers to trust it. Swarmia addresses this directly by making dashboards visible to the developers being measured, not just their managers. When people can see their own data in context, the conversation shifts from "why are you watching me" to "here's how we can improve together."
Swarmia also includes working agreements and team norms tracking, which is a thoughtful addition. Teams can define how they want to work — code review turnaround expectations, focus time commitments — and then see how well they're actually living up to those agreements.
Key Features
Developer-Visible Dashboards: Engineers see their own metrics, creating shared accountability rather than top-down surveillance.
Flow Metrics and Cycle Time Tracking: Surfaces where work slows down across the development process.
Working Agreements Tracking: Lets teams define and track adherence to their own norms and expectations.
GitHub and Jira Integrations: Clean setup with the tools most startups already use.
Best For
Startups and scale-ups with strong engineering cultures where psychological safety matters. If your team would push back on a top-down metrics program, Swarmia's transparent approach is worth considering seriously.
Pricing
Per-user monthly pricing. Visit swarmia.com for current rates and plan details.
5. Pluralsight Flow
Best for: Larger engineering organizations that want deep Git-level analysis tied to a skills platform
Pluralsight Flow is one of the original engineering analytics platforms (formerly GitPrime), offering granular Git-level productivity analysis now integrated into the broader Pluralsight learning ecosystem.
Where This Tool Shines
Flow has years of iteration behind it, and the depth of its Git analysis reflects that maturity. It goes beyond aggregate metrics to surface individual contributor patterns, PR review behavior, and commit-level activity in ways that newer tools haven't fully replicated. For organizations that need that level of granularity, it remains a strong option.
The integration with Pluralsight's skills platform creates an interesting pairing: you can see where engineers are struggling in delivery and cross-reference it with skill gaps. That connection isn't available anywhere else in this category, and it can be genuinely useful for engineering managers focused on team development alongside delivery performance.
Key Features
Deep Git and PR Analysis: Commit-level and pull request-level visibility into individual and team activity patterns.
DORA Metrics Tracking: Standard four-key metrics alongside Flow's own productivity indicators.
Individual Contributor Views: Granular per-engineer reporting, useful for performance conversations and coaching.
Pluralsight Skills Integration: Connects delivery data to the broader learning and skills development platform.
Best For
Larger engineering organizations, particularly those already using Pluralsight for learning and development. Less ideal for early-stage startups, where the enterprise pricing and setup overhead may outweigh the benefits.
Pricing
Enterprise pricing. Contact Pluralsight at pluralsight.com for a quote.
6. Waydev
Best for: Teams that need fast setup and broad version control integrations without complex configuration
Waydev is an engineering analytics platform known for quick onboarding and support for a wide range of version control and project management tools out of the box.
Where This Tool Shines
Waydev's real advantage is accessibility. If your team uses a mix of GitHub, GitLab, Bitbucket, and Jira, you can get connected and seeing data quickly without a lengthy implementation process. For teams that have been putting off analytics tooling because setup felt daunting, Waydev lowers that barrier meaningfully.
The addition of engineering OKR tracking is a practical feature that helps connect day-to-day activity to team-level goals. Automated engineering reports reduce the manual work of pulling together status updates, which matters for managers who are already stretched thin.
Key Features
Broad Integration Support: Connects to GitHub, GitLab, Bitbucket, Jira, and other common tools with minimal configuration.
Engineering OKR Tracking: Links engineering activity to team objectives for goal alignment.
Automated Engineering Reports: Generates regular reports without manual assembly, saving manager time.
Quick Setup: Designed for fast time-to-value with minimal initial configuration required.
Best For
Engineering teams with mixed toolchains who want visibility quickly without a long implementation cycle. Also a good fit for teams that want OKR tracking built into their analytics workflow rather than managed separately.
Pricing
Per-user monthly pricing. Visit waydev.co for current plan details.
7. Faros AI
Best for: Engineering ops teams that want full control over their analytics data model
Faros AI is an engineering operations platform with an open-source data connector layer, designed for teams that want to build custom analytics pipelines rather than accept a fixed dashboard structure.
Where This Tool Shines
Faros takes a fundamentally different approach from most tools in this category. Rather than giving you a pre-built dashboard, it gives you the infrastructure to build your own analytics on top of a standardized data model. For engineering ops teams with specific reporting requirements that off-the-shelf tools don't cover, this flexibility is genuinely valuable.
The open-source community edition (Faros CE) means you can start exploring the platform without a commercial commitment. Teams with the technical capacity to configure and maintain custom pipelines will get more out of Faros than teams looking for a fast, low-effort deployment.
Key Features
Open-Source Data Connectors (Faros CE): Community edition connectors covering CI/CD, VCS, incident management, and more.
Custom Analytics Pipelines: Build tailored dashboards and metrics rather than being constrained to pre-built views.
DORA Metrics and Engineering KPIs: Standard metrics available out of the box alongside custom reporting capabilities.
Broad Integration Ecosystem: Connects across version control, CI/CD, incident tools, and project management platforms.
Best For
Engineering ops teams and platform engineers at mid-to-large organizations who have specific analytics requirements and the technical capacity to build and maintain custom pipelines. Less suited to small teams that need quick time-to-value with minimal configuration.
Pricing
Open-source core is freely available. Commercial platform pricing is available on request. Visit faros.ai for details.
8. Axify
Best for: Small teams that want DORA metrics and flow efficiency without individual surveillance
Axify is a lightweight engineering analytics tool focused on DORA metrics and flow efficiency, built around a team-level data philosophy that deliberately avoids individual-level surveillance.
Where This Tool Shines
Axify's privacy-conscious design is a deliberate product choice, not just a feature checkbox. All metrics are aggregated at the team level, which removes the surveillance dynamic that makes engineers uncomfortable with analytics programs. For startups where trust and psychological safety are cultural priorities, this posture matters.
The tool stays focused on what it does well: DORA baselines and flow efficiency. That narrower scope makes it easier to adopt and interpret than broader platforms. If your primary goal is establishing solid delivery metrics without overwhelming your team with data, Axify's simplicity is a genuine strength.
Key Features
DORA Metrics Baseline Tracking: Clean implementation of the four key metrics for tracking delivery performance over time.
Flow Efficiency and Bottleneck Identification: Surfaces where work slows down in the development pipeline.
Team-Level Aggregation: Privacy-conscious design that measures team health without individual surveillance.
GitHub and GitLab Integrations: Straightforward setup with the most common version control platforms.
Best For
Small engineering teams and startups that want clean DORA tracking without the overhead of a heavy platform. A strong fit for teams where engineer trust is a priority and individual-level monitoring would create cultural friction.
Pricing
Per-team monthly pricing. Visit axify.io for current rates.
9. Haystack
Best for: Teams where code review bottlenecks are the primary delivery friction point
Haystack is a PR-focused engineering analytics tool that specializes in cycle time analysis and code review bottleneck detection.
Where This Tool Shines
Haystack does one thing exceptionally well: it makes the code review process visible. Pull request cycle time, reviewer load distribution, and review turnaround patterns are often the hidden culprit behind slow delivery, and most broader analytics tools only skim this layer. Haystack goes deep here, giving teams a clear picture of where PRs are getting stuck and why.
For teams where code review is a known friction point — or where you suspect it might be but lack the data to confirm it — Haystack can surface those bottlenecks quickly. It also works well as a complement to broader platforms that track higher-level delivery metrics but don't drill into PR-level dynamics.
Key Features
Pull Request Cycle Time Tracking: Detailed visibility into how long PRs spend at each stage from open to merge.
Code Review Turnaround and Reviewer Load Analysis: Identifies review bottlenecks and uneven reviewer distribution across the team.
Deployment Frequency and Lead Time Metrics: Core DORA metrics alongside the PR-specific analytics.
GitHub and GitLab Integrations: Clean integration with the most widely used version control platforms.
Best For
Engineering teams where code review velocity is a known or suspected bottleneck. Also a useful complement to broader analytics platforms for teams that want deeper PR-level insight than their primary tool provides.
Pricing
Per-user monthly pricing. Visit usehaystack.io for current plan details.
Which Tool Is Right for Your Team?
The right choice depends less on which tool has the most features and more on what kind of problem you're actually trying to solve.
If you need pre-computed risk signals and team health reads without spending hours in dashboards, Progress is the strongest option in this list. It's built specifically for technical leaders who need to act on engineering data, not just look at it. The natural-language Q&A and executive summary capabilities make it particularly useful for startup CTOs and engineering managers who need to communicate clearly upward and downward.
If your priority is DORA metrics with industry benchmarking, LinearB is a well-established choice with a solid free tier for getting started. For connecting engineering investment to business outcomes in executive reporting, Jellyfish is the category leader. If team transparency and engineer trust are cultural priorities, Swarmia and Axify both take a developer-friendly approach worth considering. And if code review is your primary bottleneck, Haystack offers the deepest PR-level analysis available.
The broader point: most teams don't need more data. They need better interpretation of the data they already have. That's the gap that engineering intelligence platforms are built to close, and it's the problem Progress was designed to solve from the ground up.
Ready to see what your engineering data is actually telling you? Learn more about our services and find out how Progress can help your team move from data overload to decision-ready insight.