
Team Momentum Analysis: How Engineering Leaders Can Tell If Work Is Accelerating or Stalling
Team momentum analysis helps engineering leaders move beyond surface-level productivity metrics to identify whether their team is genuinely accelerating toward goals or quietly stalling. This discipline focuses on tracking directional energy over time, giving leaders the language and signals needed to diagnose delivery gaps before they become critical problems.
The sprint ends. The board looks busy. Tickets are moving, PRs are merging, and the standup updates sound reasonable. But something feels off. Delivery is slower than it should be, a key initiative seems to be going nowhere in particular, and when you try to explain it to leadership, you find yourself reaching for words that don't quite land.
This is one of the most common frustrations in startup engineering: the gap between visible activity and actual progress. You have data, but the data isn't telling you what you actually need to know. The team looks productive by every standard metric, yet the work isn't accelerating toward the goal the way it should be.
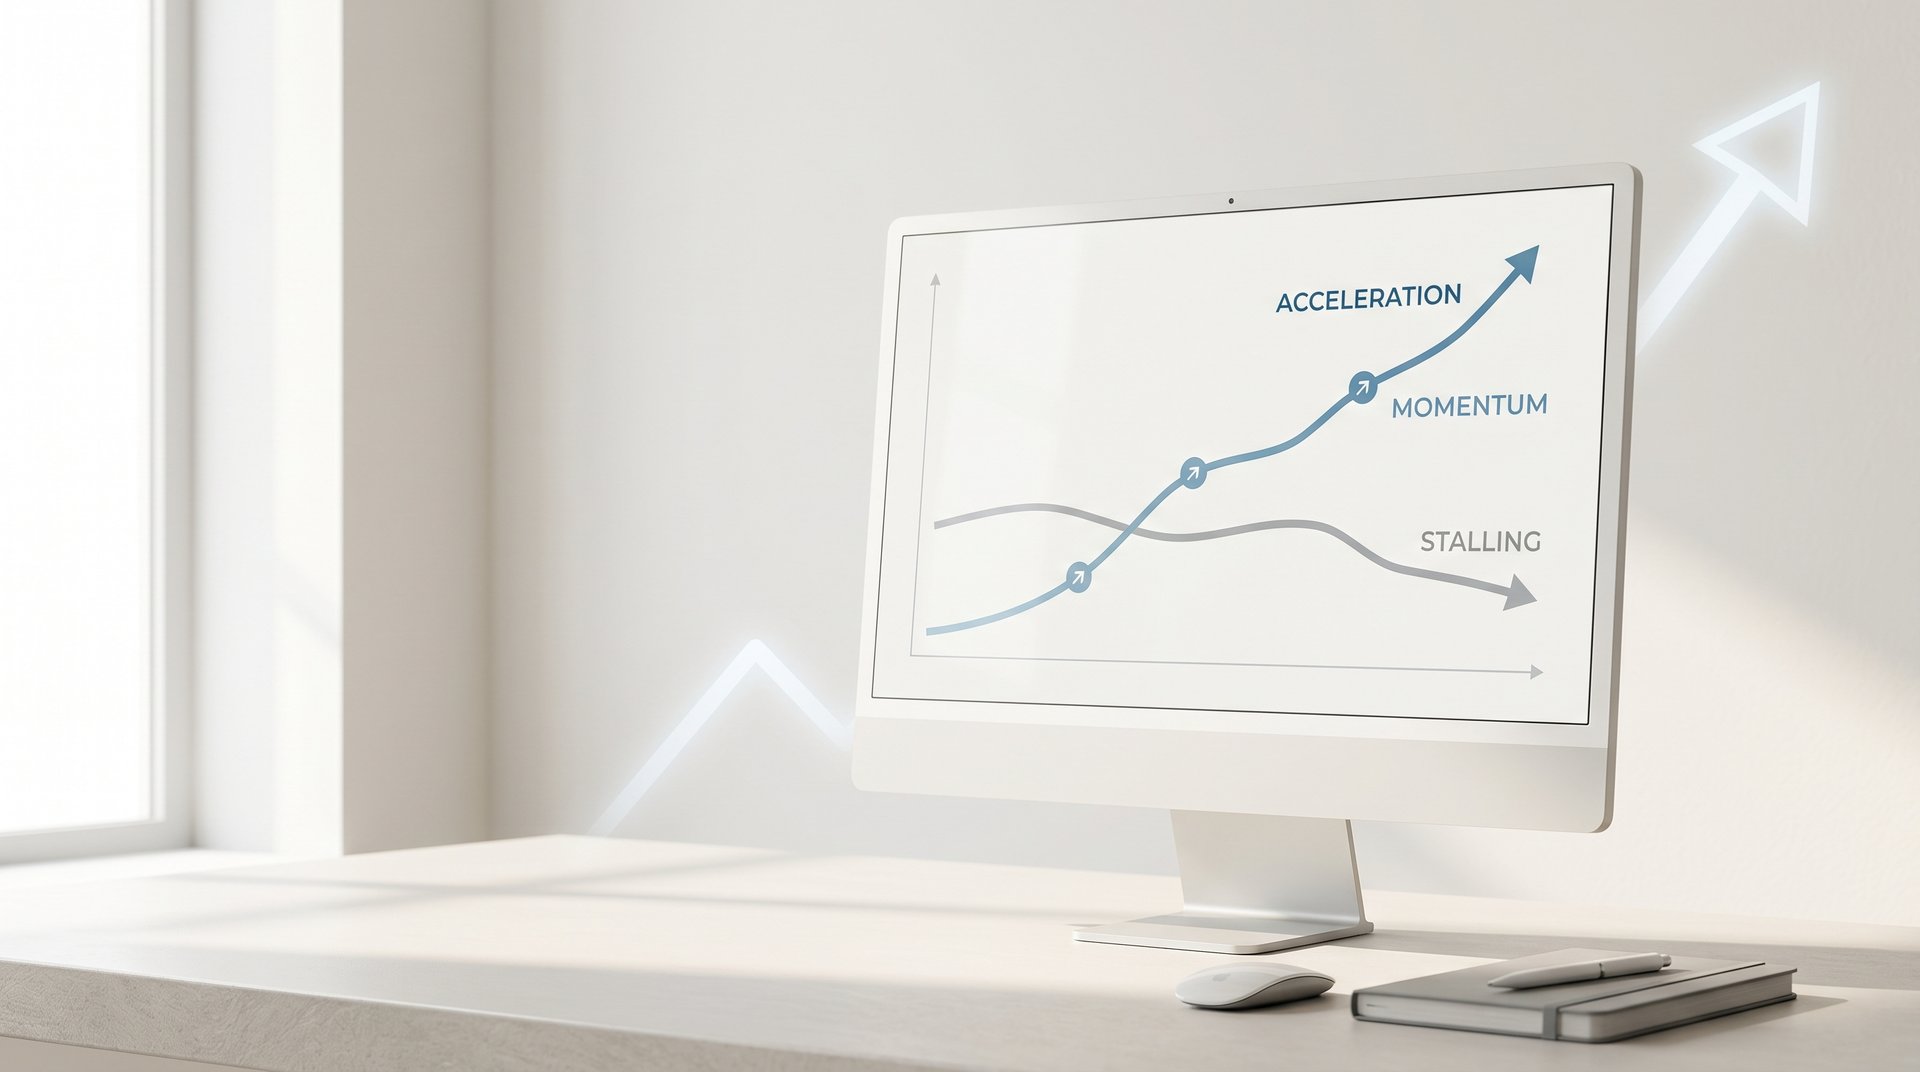
What's missing is a signal for momentum. Not a count of how much work happened, but a read on whether the team is building toward something or quietly losing ground. Team momentum analysis is the discipline of tracking that signal: understanding the directional energy of a team over time, spotting when it shifts, and acting early enough to course-correct before the cost compounds.
This article breaks down what team momentum analysis is, why it matters especially for startup engineering teams, what it actually measures, and how modern tooling has made it practical to surface these signals without adding overhead to an already stretched technical leader's day.
The Difference Between Busy and Moving Forward
Momentum, in an engineering context, isn't about volume. It's about direction and rate of change. A team has strong momentum when work is flowing consistently toward meaningful outcomes: features shipping, initiatives advancing, cycle times holding steady or improving. A team is losing momentum when that flow is quietly degrading, even if the surface-level activity metrics still look fine.
This distinction matters because the most common engineering metrics are not designed to catch momentum loss. Story points completed, PR count, velocity charts: these are throughput measures. They tell you how much happened, not whether what happened is moving the team toward its goals or spinning in place.
Think of it like a car's speedometer versus its GPS. The speedometer tells you how fast the wheels are turning. The GPS tells you whether you're actually getting closer to the destination. A team can be burning rubber on a roundabout and the speedometer will look great the entire time.
This is why momentum is better understood as a pattern signal rather than a point-in-time metric. A single sprint's data tells you almost nothing about momentum. What matters is the trend: is cycle time creeping up week over week? Is merge frequency spiking at the end of each sprint and then going quiet? Are certain workstreams consistently showing activity without corresponding delivery milestones?
These patterns require looking at how work flows through a system over time, not just snapshotting what happened in a given window. That's a fundamentally different kind of analysis than most teams are set up to do manually, especially when leaders are already context-switching across multiple workstreams and competing priorities.
The concept draws directly from lean and agile thinking, specifically the idea that flow efficiency is a more meaningful signal than throughput volume alone. The DORA metrics framework, developed by the DevOps Research and Assessment program and detailed in the book Accelerate by Nicole Forsgren, Jez Humble, and Gene Kim, established deployment frequency, lead time for changes, and related signals as meaningful indicators of delivery health. Team momentum analysis extends this thinking by treating these signals as a trend pattern rather than a benchmark snapshot, asking not just "where are we?" but "which direction are we heading, and how fast?"
Getting this right requires moving past the comfort of dashboards that confirm activity and toward systems that surface directional truth, even when that truth is inconvenient.
What Goes Into a Real Momentum Read
If momentum is a pattern signal, what are the actual inputs? A meaningful momentum analysis draws from several overlapping data streams, and the value comes from reading them together rather than in isolation.
Code churn: Churn is the rate at which code is added, modified, or deleted. Some churn is healthy and expected, especially in fast-moving startup environments. But high churn without corresponding delivery is a warning sign. It often indicates rework, unclear requirements, or underlying technical instability. When a team is rewriting the same code repeatedly without shipping, that's momentum burning without forward movement.
Cycle time trends: Cycle time measures how long work takes to move from start to done. A single cycle time number is a baseline. A rising trend in cycle time over multiple sprints is an early warning signal. It suggests something in the system is creating drag, whether that's growing complexity, unclear scope, review bottlenecks, or team capacity issues. Catching this trend early is far less costly than diagnosing it after a missed deadline.
Merge frequency and change pressure: The pace of code integration relative to a team's own baseline reveals a lot about how work is actually flowing. Consistent merge cadence across a sprint suggests steady progress. Sudden spikes concentrated at the end of a sprint, followed by quiet periods, can indicate sprint-end rushes where work is crammed through rather than developed steadily. This kind of change pressure can also signal unsustainable delivery patterns that erode quality over time.
Contributor activity patterns: This is the human layer that most engineering metrics tools ignore entirely. How actively are individual contributors engaging with the codebase over time? Are certain team members becoming less active, submitting fewer PRs, or reviewing less? Shifts in contributor engagement are often the earliest signal of morale or wellness issues, surfacing weeks before they show up in delivery data or in a 1:1 conversation.
Initiative health: Beyond code-level signals, momentum analysis should track whether specific workstreams and projects are actually advancing. An initiative that shows consistent activity but no milestone progress is stalled, even if the team working on it looks busy by other measures. Tracking initiative health across multiple workstreams simultaneously gives leaders a portfolio-level view of where momentum is healthy and where it's at risk.
The insight here is that no single metric tells the whole story. Code churn alone could mean active development or chronic rework. Merge frequency alone could mean healthy throughput or unsustainable pressure. It's the combination of these signals, read as trends over time, that produces a genuine momentum read.
Why Startup Teams Feel This Harder and Faster
Momentum loss is a problem for engineering teams of all sizes, but startup engineering teams are particularly exposed to its effects. The reasons are structural.
Small teams have less redundancy. On a squad of five or six engineers, one blocked initiative doesn't just slow a workstream: it can visibly drag the entire team's output. One disengaged senior engineer who's quietly checking out can reshape the team's delivery capacity in ways that won't show up in a velocity chart until the damage is already done.
Startup development environments are also high-context and fast-moving by nature. Priorities shift, scope changes, and technical decisions compound quickly. Leaders in this environment are often context-switching constantly across product, hiring, investor conversations, and team management. The bandwidth to manually track momentum signals across multiple workstreams simply isn't there, even for highly capable technical leaders who understand what to look for.
This creates a dangerous gap. The signals that would allow early intervention are available in the data, but nobody has the time or tooling to surface them before they become visible problems. By the time a momentum issue shows up in a missed deadline or a tense team retro, it's been building for weeks.
The cost of late detection compounds quickly in startup environments. A stalled initiative that goes unnoticed for a few weeks can translate into a missed product milestone. A morale dip that isn't caught early can become an attrition risk. Technical debt that accumulates during a period of unsustainable change pressure can slow the next quarter's delivery even after the original pressure is gone. These effects layer on top of each other in ways that are genuinely hard to unwind.
There's also a communication dimension. Startup leadership teams often rely on engineering managers to surface these signals through status updates and sprint reviews. But when the manager themselves is operating without clear momentum data, those updates tend to be optimistic by default. Not because anyone is being dishonest, but because the signals that would prompt a different kind of conversation aren't visible yet. The result is a leadership team that thinks things are on track until they suddenly aren't.
For startup engineering teams, momentum analysis isn't a nice-to-have. It's one of the few signals that can give technical leaders genuine advance warning before a problem becomes a crisis.
From Passive Dashboards to Active Intelligence
For a long time, the standard answer to engineering visibility was better dashboards. Connect your GitHub and your project management tool, generate some charts, and review them in your weekly planning meeting. The data was there. The interpretation was left entirely to you.
The problem with passive dashboards is that they require the human to do the analytical work that the tool should be doing. A chart showing rising cycle time over six weeks is useful, but only if someone is looking at it with enough context to recognize the pattern, connect it to other signals, and draw a conclusion worth acting on. In a startup environment where that person is also managing hiring, fielding product questions, and preparing for a board update, that analysis often doesn't happen until after the fact.
The shift happening now is from passive data aggregation toward active intelligence: systems that don't just display data but interpret it, pre-computing assessments and surfacing risks without requiring a human to dig through charts to find them.
This is the problem Progress was built to solve. Progress is an AI-native engineering intelligence platform that ingests data from the tools teams already use, including Linear, GitHub, and similar systems, and continuously analyzes it to surface what's actually happening across a codebase and a team. The key word is "interprets." Rather than handing you a dashboard and leaving the analysis to you, Progress delivers pre-computed operational signals: where the risk is, what's stalling, how the team is actually doing.
Core capabilities include deployment risk and change-pressure assessment based on merge volume and code churn, initiative and workstream health tracking, team momentum analysis that flags whether work is accelerating or decelerating, and team morale and wellness reads that surface contributor engagement shifts before they affect delivery. It also generates executive summaries on demand, giving technical leaders and startup management a shared, accurate picture without requiring a status meeting to produce it.
One of the more distinctive capabilities is the MCP server and Claude API integration, which lets technical leaders ask plain-language questions about engineering activity and get answers grounded in real data. Instead of pulling a report and manually correlating signals, a leader can ask something like "which initiatives are at risk this week and why?" and receive an answer built from actual activity data, not vanity metrics or manually curated status updates.
For startup teams that are skeptical of tools that add overhead without clear signal value, this distinction matters. Progress isn't asking you to build new workflows around it. It's reading the data your team is already generating and making it interpretable, which is a fundamentally different value proposition than another dashboard.
What Healthy Momentum Looks Like, and What Decay Looks Like
Understanding momentum analysis in the abstract is useful. Knowing what to actually look for in practice is what makes it actionable.
Healthy momentum in an engineering team has a recognizable shape. Merge cadence is consistent across the sprint rather than concentrated in a last-minute rush. Cycle times are stable or trending downward, indicating that the team is getting better at moving work through the system. Initiative health tracking shows workstreams advancing: not just showing activity, but hitting milestones and moving toward completion. Contributor activity is distributed and engaged, with no obvious drop-offs in individual participation. Deployment risk indicators are manageable, meaning change pressure is within the team's established baseline.
Momentum decay also has a recognizable shape, though it's easier to miss because the surface metrics can still look acceptable while the underlying patterns are degrading.
Rising code churn without corresponding delivery is one of the clearest early signals. If the team is writing and rewriting code at a high rate but shipping less, something is creating drag in the system. It might be unclear requirements, technical instability, or scope creep, but the pattern itself is worth investigating before it becomes a delivery problem.
Stalled PRs accumulating is another warning sign. When pull requests sit in review for longer than usual, or when certain PRs keep getting revised without merging, it often indicates either a bottleneck in the review process or underlying disagreement about the work itself. Either way, it's friction that slows momentum.
Contributor activity patterns shifting deserves particular attention. If a previously active engineer starts submitting fewer PRs, reviewing less, or engaging less with the codebase, that's a signal worth noticing. It doesn't always mean something is wrong, but it's the kind of early indicator that's much easier to address with a conversation than to unwind after the fact.
Deployment risk indicators climbing suggests that change pressure is building to a point where quality and stability are at risk. This often happens when teams are pushing hard to hit a deadline and the pace of merges relative to their baseline starts to spike.
The value of executive summaries generated from live activity data is that they make this picture visible to both engineering managers and startup leadership simultaneously. Instead of a status meeting where the manager summarizes what they believe is happening, everyone is working from the same data-grounded read. That shared visibility changes the quality of the conversation and removes the friction of having to explain why you're concerned about something that doesn't look alarming on the surface metrics.
Making Momentum Visible Before It Becomes a Problem
The core argument for team momentum analysis is straightforward: activity is not the same as progress, and the gap between them is where delivery risk lives. A team can be genuinely busy while a key initiative quietly stalls. A team can look healthy on a velocity chart while contributor engagement is eroding. A sprint can close with every ticket moved while the actual goal of the sprint remains unreached.
Momentum analysis bridges that gap. It tells you not just what your team did, but whether they are building toward something or quietly losing ground. And because it's a trend signal rather than a point-in-time snapshot, it surfaces these patterns early, when intervention is still low-cost: a conversation, a scope adjustment, a process change. Not a crisis response.
For technical leaders in startup environments, the practical implication is clear. Moving beyond lagging indicators like missed deadlines and negative retrospectives means investing in systems that surface momentum signals while there's still time to act on them. That doesn't require adding overhead or building new workflows. It requires tooling that interprets the data your team is already generating and makes it decision-ready.
Progress is built specifically for this. It's an engineering intelligence platform that reads the signals in your existing development activity and surfaces them as actionable assessments, not charts that require manual analysis. If your team is already using GitHub, Linear, or similar tools, the data is there. The question is whether you have a system that's turning it into the kind of momentum signal you can actually act on.
If you're leading an engineering team and you've felt the frustration of having data without interpretation, or being busy without being sure the team is actually making progress, that's exactly the problem this is designed to solve. Learn more about our services and see how Progress helps engineering teams turn development activity into actionable momentum signals.